
In this articlepublished earlier, we discussed that both the markets, equity and debt, look stretched on valuations. At that point of time, the yield on the 10-year government security was approx 6.5% and the overnight interest rate, represented by the RBI repo rate, was 6.25%. The spread was only 25 basis points between overnight and 10-years. This was an anomaly as per the theory of time value of money because the compensation was only 25 basis points for sparing money for 10 years.
Since then, the RBI has cut policy rate in August ’17, thereby bringing the overnight rate to 6%. The bond market has corrected and the 10-year G-Sec yield currently is at around 7.35%, taking the average of the existing benchmark 6.79% GoI 2027 and the new benchmark 7.17% GoI 2028. The 10-year to overnight spread at approx 1.35% is attractive.
The equity market has run up further since July ’17. The PE Ratio in July ’17 was approx 25 on trailing EPS basis. Currently, it is approx 27.5 on trailing EPS basis. As per the thumb rule to figure out the relative attractiveness between the two markets i.e. equity and debt, the inverse of the 10-year bond yield is compared with the equity PE. Inverse of 7.35% is 13.6, which denotes that if the equity PE is at or less than 13.6, equity is very attractive. Now that equity PE is at approx 27.5, it is not cheap. However, the equity market may witness a PE rerating driven by better earnings growth. Since there is a discounting of future growth in equities, which is not the case with bonds, some premium is justified.
Let us now look at what history tells us by taking a cue from movement in one market and impact on the other.
Source: IDFC Mutual Fund Report dated Jan ’18
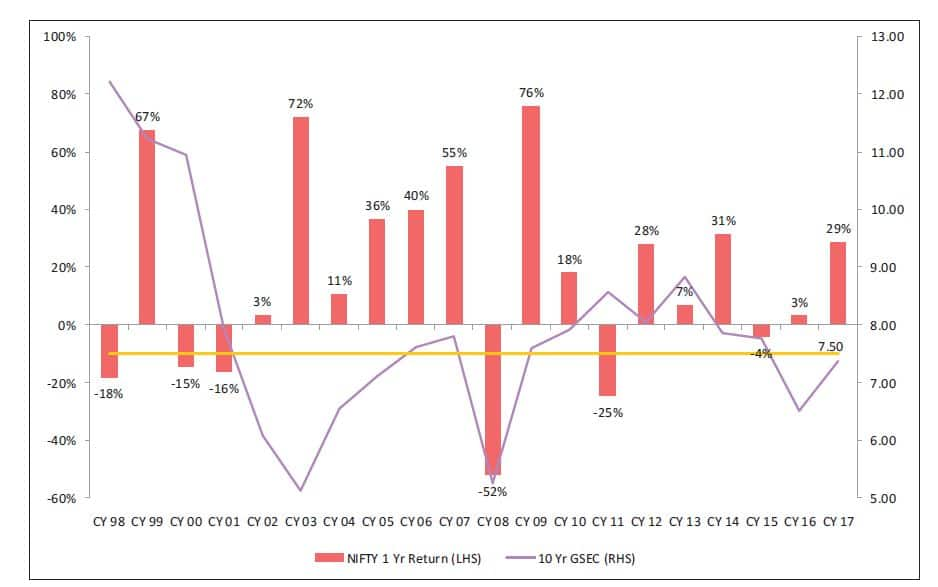
The chart above shows the 10-year Government Security yield (line, marked to right hand side) and returns from Nifty over next one year (bars, marked to left hand side). It presents a long history, from CY98 to CY17. It is not a perfect correlation, because markets are influenced by a multitude of dynamic factors. Broadly, when bond yield is moving up, returns from Nifty have been moving up and vice versa.
This is because yield moves up when the economy is looking up and demand for money is higher. When growth in the economy is picking up, inflation also picks up. Consequently, earnings growth of corporates, which is measured in nominal terms (i.e. not adjusted for inflation) is that much higher. On the reverse side, when the economy is slowing down, demand for money is lower as fresh capacities are not created, leading to lower interest rates. With slowing economy and easing inflation, corporate earnings growth is soft. Hence, earnings from equity is muted.
From CY03 to CY07, we see bond yield moving up and equity returns buoyant. In CY08, both move southwards. From CY09 to CY14, both move in similar fashion, apart from one exception in CY11. At the current juncture, corporate earnings growth is expected to gather pace. Given that bond yields have moved up over the last 7 months or so, GDP growth is projected to pick up and inflation is projected to be little higher than RBI’s central target of 4%, all this are positive indicators for equities. The only cause for concern in equity is the stretched valuations.
Having said that, calling the market is anybody’s guess. As investors, we should be guided by prudent allocation between the two asset classes. Allocation should be guided by the parameters ofrisk-return profileand horizon. In case the equity valuation looks stretched, invest with a long horizon. In the fixed income segment, things are expected to be stable in the foreseeable future as the RBI is not going to hike rates in a hurry.
Another perspective, for deployment of incremental flows of investors in view of uncertainty in equity market on stretched valuations, could be alternate avenues like structured products (market linked debentures), where the downside in case equity markets don’t give returns is protected but the market linked coupon provides the equity upside. This is suitable for investors who want to participate in the equity market upside but are wary of the downside. However, there is a minimum ticket size required for structured debentures and is available to HNIs, not retail investors. In the mutual fund space, there are certain funds that do the asset allocation between equity and debt as per valuation levels in the market and restructure the portfolio at periodic intervals, as per the fund manager’s views on market movements. Retail investors, as well as HNIs, can take the benefit of the fund managers’ allocation in these dynamic asset allocation funds.