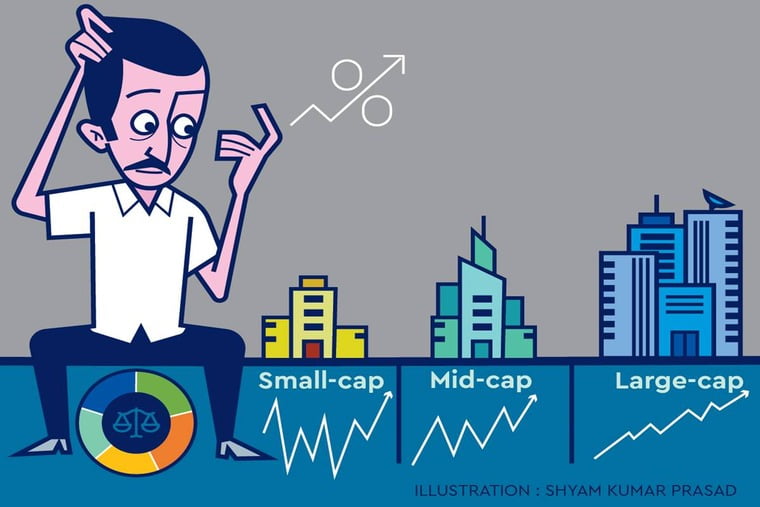
Net-net, small cap stocks have relatively higher risk and relatively higher growth potential than large cap ones.
There are thousands of stocks listed at the stock exchanges. The generally accepted broad categorisation is large cap, mid cap and small cap, as per the total market capitalisation of the listed companies. What is large and what is small is a matter of debate, but for the mutual fund industry, it has been defined by the Securities and Exchange Board of India (Sebi).
For mutual fund schemes, the top 100 companies as per market cap are defined as large cap, the next 150 are defined as mid cap and the rest are small cap. From your perspective, you may take exposure either through mutual funds, or buy stocks directly through a broker. For mutual funds, you may be taking the inputs of an adviser / distributor and for direct stocks you may take the recommendations of a broker / advisor.
The overall allocation in your portfolio should preferably be advised by a financial planner, or you may be doing it yourself. Similar to doing allocation to various investments such as equity, debt, gold, etc., within equity you would be doing the allocation to large, mid and small cap stocks. You have to modulate the exposure to MF schemes / direct stocks to optimise the allocation.
The nature of difference
The large cap stocks have already been discovered by the market, which is why they are big. This is not a comment on the growth potential of a large cap company; a large cap stock may or may not have potential for price appreciation, which time will tell. A relatively smaller company may have a higher potential for growth and price appreciation, being in the early stage. However, if the business is yet to gain critical mass, the risk also is higher. Net-net, small cap stocks have relatively higher risk and relatively higher growth potential than large cap ones.
To look at some data on what we are talking about, we have taken the Nifty 50 index to represent large cap stocks and Nifty Smallcap 100 index for small cap stocks. In the severely volatile phase of January to March 2020, the fall from peak to trough will give an indication, which is technically known as drawdown. Nifty 50 index, from the peak of January 14, 2020 to the bottom of March 23, 2020, fell by 38.4%. In the similar period, Nifty Smallcap index, from the peak of January 27, 2020 to the trough on March 24, 2020, had a drawdown of 47.4%.
This is an example of what we had referred to as higher volatility. Now coming to the potential, from the bottom on March 23, 2020 till June 30, 2021, Nifty 50 gained 77%. The losses of January to March 2020 have been wiped off and investors have earned handsome returns. As against this, from the bottom on March 24, 2020 till June 30, 2021, Nifty Smallcap index has delivered 132%. Usually, when the economy is recovering from a slowdown, large cap ones recover faster as the resilience is higher.
This time, in the phase of recovery from the pandemic and lockdown, something else is happening. Probably the formal sector, the listed stocks, have gained at the cost of the even smaller ones, the unlisted micro, small and medium enterprises (MSMEs) who are facing greater difficulties.
Conclusion
There are different views on the growth potential of large and small cap segments. The numbers show that small cap has relatively higher potential on both sides, i.e., upside and downside. You may do the allocation in your portfolio accordingly. In the small cap space, the universe of stocks being large with so many less-discovered companies, stock picking skills are more relevant than in the large cap segment.
Source: https://www.financialexpress.com/money/equity-investing-large-cap-vs-small-cap-balancing-growth-risks/2285201/


